WaveTrend & RSI Combined (v-final)# RSI Divergence + WaveTrend Combined
## Overview
This indicator combines RSI Divergence detection with WaveTrend crosses to generate high-probability trading signals. It filters out noise by only showing divergences when confirmed by WaveTrend momentum crosses in the same direction.
## Key Features
### 1. Smart Divergence Detection
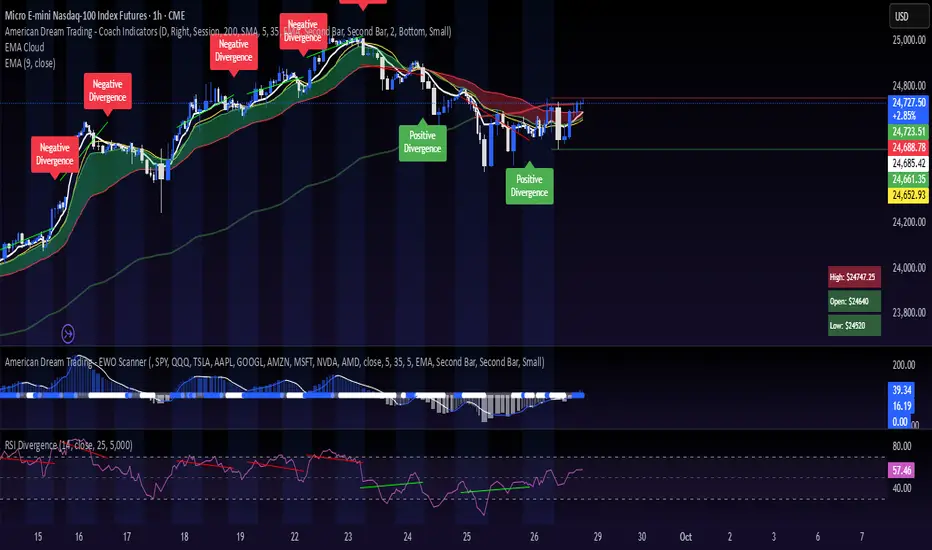
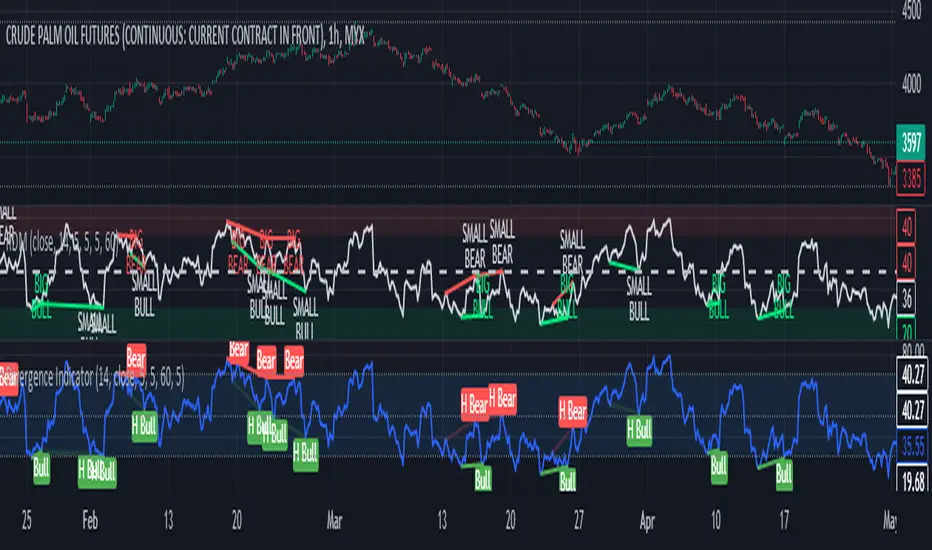
- Detects both bullish and bearish RSI divergences
- Uses **price pivot validation** to ensure divergences start from significant chart highs/lows, not just RSI extremes
- Divergence endpoints must be in the **neutral zone (20-80)** to avoid overbought/oversold traps
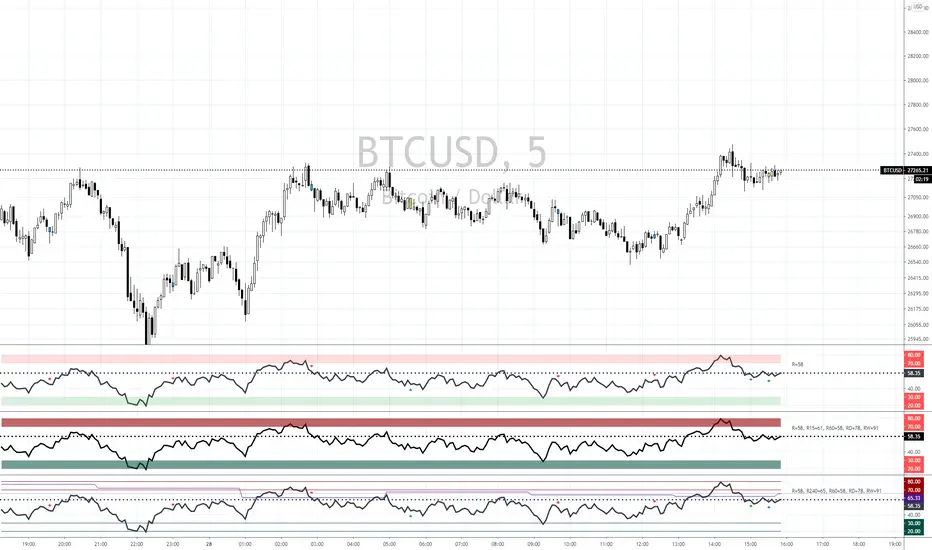
### 2. WaveTrend Cross Confirmation
- **Golden Cross**: WaveTrend crossover in oversold territory (below -60)
- **Dead Cross**: WaveTrend crossover in overbought territory (above +60)
- Crosses are displayed at RSI 20 (golden) and RSI 80 (dead) levels for easy visualization
### 3. Combined Signal Logic
- **LONG Signal**: Bullish RSI Divergence + Golden Cross within the divergence period
- **SHORT Signal**: Bearish RSI Divergence + Dead Cross within the divergence period
- Divergences are **only displayed** when a matching cross exists in the same period
### 4. Visual Elements
- **Yellow lines**: Divergence connections between master point and current point
- **Small diamonds**: Divergence markers (green for bullish, red for bearish)
- **Triangles**: Confirmed entry signals (▲ for LONG, ▼ for SHORT)
- **Circles**: WaveTrend crosses (green at bottom for golden, red at top for dead)
- **Background color**: Highlights signal bars (green for LONG, red for SHORT)
- **Debug table**: Shows real-time RSI, divergence count, WaveTrend values, and cross status
## Settings
### RSI Divergence
- RSI Length (default: 14)
- Overbuy/Oversell levels
- Divergence detection parameters (loopback, confirmation, limits)
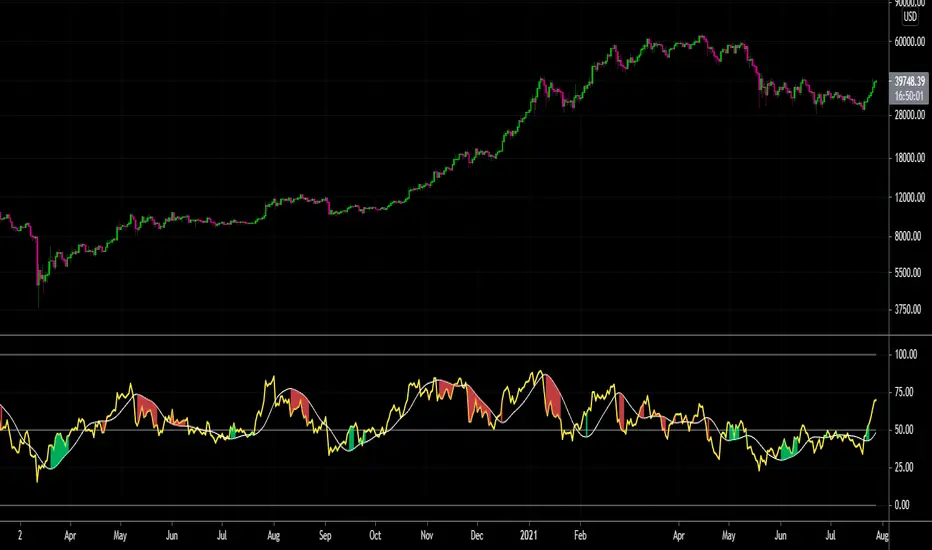
### WaveTrend
- Channel Length (default: 10)
- Average Length (default: 21)
- Overbought/Oversold levels
- Cross Detection Level (default: 60)
### Pivot Detection
- Pivot Left/Right Bars (default: 5) - Controls sensitivity for price pivot validation
## How to Use
1. **Wait for signal**: Look for the triangle markers (▲/▼) with background color
2. **Confirm with crosses**: Ensure the corresponding WaveTrend cross (circle) is visible
3. **Check divergence line**: The yellow line should connect meaningful price pivots
## Alerts
- Built-in alert conditions for both LONG and SHORT signals
- Webhook-ready format for automation (Telegram, Discord, auto-trading bots)
## Best Practices
- Works well on higher timeframes (1H, 4H, Daily)
- Combine with support/resistance levels for better entries
- Use proper risk management - not every signal is a winner
## Credits
- RSI Divergence logic inspired by K-zax
- WaveTrend calculation based on LazyBear's implementation
- Combined and enhanced by sondengs
---
*This indicator is for educational purposes only. Always do your own research and manage your risk appropriately.*
Pine Script® インジケーター